
Understanding Findose’s Autotrender – Use It Like a Pro
Autotrender is a tool or indicator that indicates intraday basis real-time market sentiment based on options data. Autotrender has one of the best-automated analytics which helps you make better option trading decisions and saves you against the market position.
Number Chart:

1. TIME: NSE options data updates every 3 minutes & our data updates in every 10 minutes so with every update we are showing 3 NSE updates which is the most reliable data.
2. CALL: The total open interest(OI) for Call options at the given time. This shows the total number of outstanding Call option contracts.
3. PUT: The total open interest (OI) for Put options at the given time. This shows the total number of outstanding Put option contracts.
4. DIFFERENCE: The difference between Call open interest and Put open interest (PUT-CALL = Difference). A negative value suggests higher Call open interest and a positive value indicates higher Put open interest.
5. PCR (Put-Call Ratio): This is the most commonly used sentiment indicator in options trading:
- PCR > 1.20 Indicates the Market can go upside means a Bullish sentiment (more Put open interest).
- PCR < 0.80 Indicates the Market can go downside means a Bearish sentiment (more Call open interest).
- PCR between 0.80 to 1.20 indicates the Market can trade in a range that means a Neutral sentiment (equal Call & Put 0pen Interest).
6. EXPIRY PCR: The Put-Call Ratio is calculated specifically for Expiry day. It helps in assessing long-term sentiment for the expiry date.
7. OPTION SIGNAL: Indicates the market sentiment based on the data is “BUY” or “SELL.” In this image, all entries show “SELL,” suggesting a bearish sentiment throughout.
- BUY: Indicates the Market can go upside so options sellers can sell PE and buyers can buy CE.
- SELL: Indicates the Market can go downside so options sellers can sell CE and buyers can buy PE.
8. PRICE: The market price of the underlying index at the given time. This helps track price movements with options data whether price is going with Autotrender’s data or not.
Line Chart:
Line Chart represents the strength of a trend. if the Green line keeps going in one direction against the red line it means the trend is very strong.
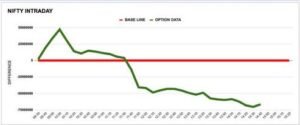
1. Red Line/Base Line: The Red line of line charts represents value 0 and acts as a baseline.
2. Green Line: The Green line represents the difference between Put & Call Options Open Interest called Option Data.
- If the Green line is above the Red Line (or above 0) indicates the Market has a Bullish sentiment.
- If the Green line is below the Red Line (or below 0) indicates the Market has a Bearish sentiment.
Bar Chart:
The bar chart is mostly used for identifying reversals or changes in the trend. if market is going to change its direction from Upside to down & from Down Side to Up than Bar Chart can indicate it before. bar Chart has 2 component –

- Green Bars (Bulls): Green Bars represent Bulls if it is higher than Red Bars means the market has a Bullish Sentiment. If the Green Bar is higher than the Red bar & keeps going higher indicates the market can go in the same UP direction. If Green bars started going down and Red bars stared going Up indicates a reversal (The market can go down). (refer image)
- Red Bars (Bears): Red Bars represent Bears if it is higher than the Green Bars means the market has a Bearish Sentiment. If the Red Bar is higher than the Green bar & keeps going higher indicates the market can go in the same Down direction. If Red bars started going down and Green bars started going Up indicates a reversal (The market can go up). (refer image)